Viewing Triggered Experiences Overview
Triggered Experience Overview gives us a summary of metrics related to triggered experiences over a selected time range.
To view the triggered experience overview,
- Click the Insights menu.
- In the Insights menu, click the Triggered Experiences tab.
The Triggered Experience Overview window displays the triggered experience metrics for the past 30 days. - Click the Time Range selector located in the top right corner of the page to select Time Range.
The metrics are displayed as per the selected time range.
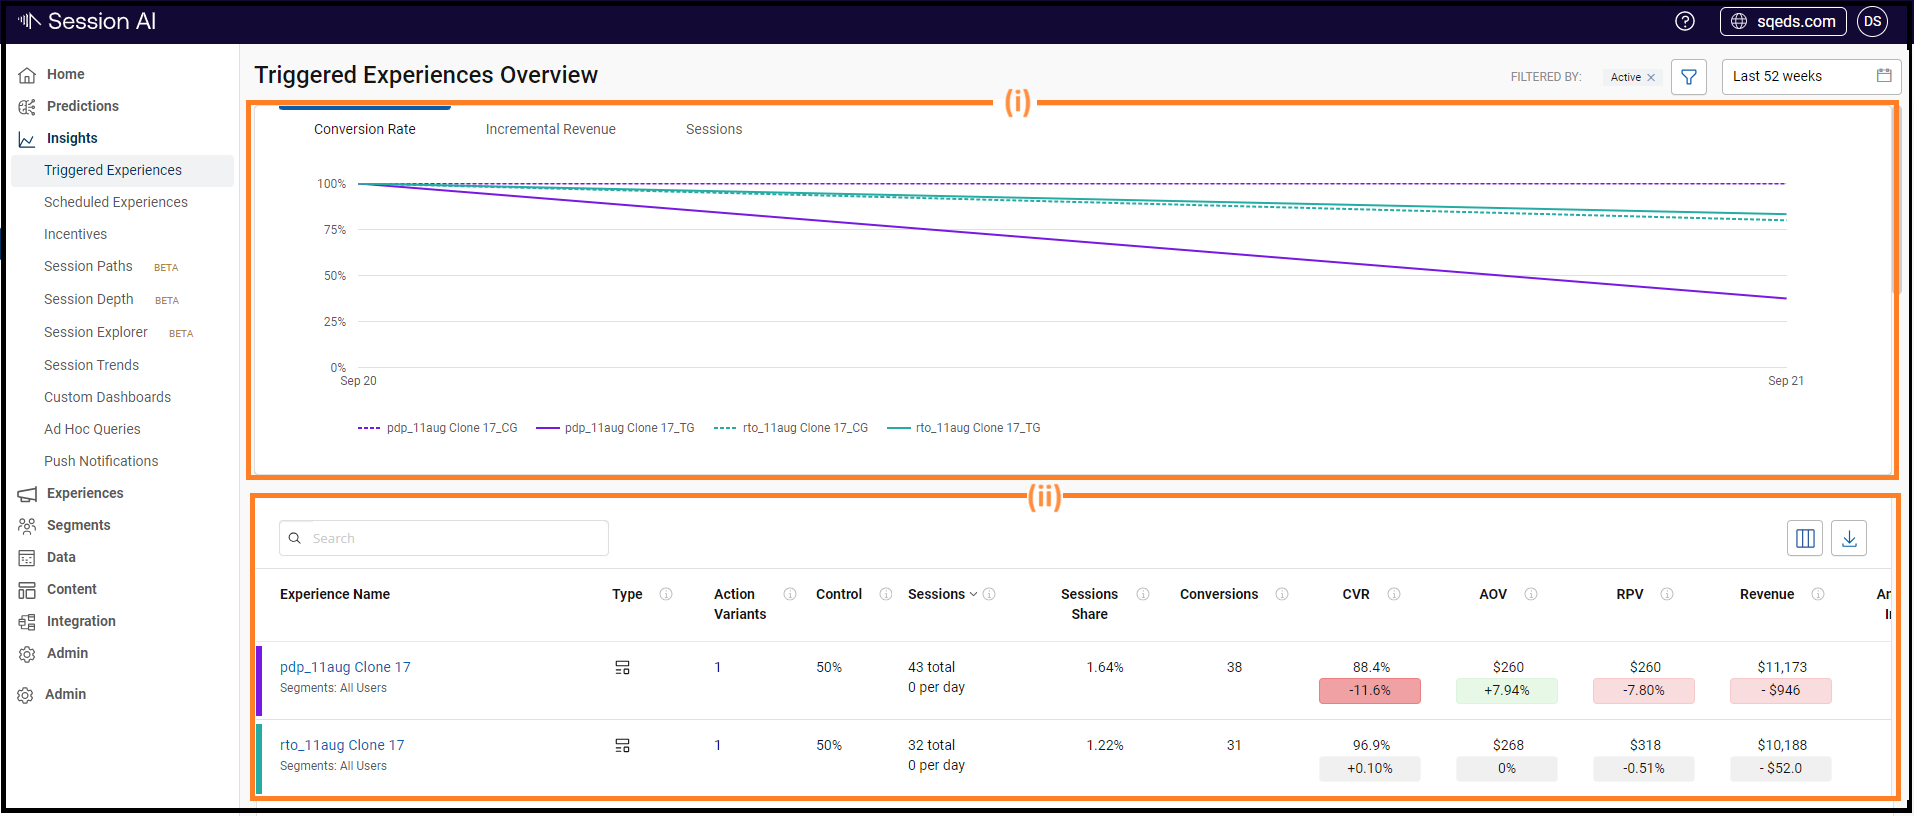
The Triggered Experiences page has two panes:
i. Time Series Metrics: This pane displays a line chart that shows the time series metrics for "Session", "Conversion Rate" and "Incremental Revenue" in different tabs. These metrics display the session count, conversion rate, and
Incremental revenue for top 10 Experiences. Where the top 10 is defined as the 10 experiences with the highest session counts.
Note: Click the Triggered Experience name legend, and the line chart for that experience will disappear and vice versa
ii. Experience Metrics table: This pane displays the information and different metrics for triggered experiences.
The Table given below describes different fields present in pane number (ii).
| Field | Description |
|---|---|
| Experience Name | Displays the name of the Experience, description, and the selected segments.
|
| Action Variants | Displays the total number of actions used in that Triggered Experience |
| Control | Displays the percentage of the control group set for the experience. |
| Sessions |
|
| Sessions Score | Displays the percentage of total sessions for this experience with respect to total sessions for the namespace. |
| Conversions | Displays the number of sessions in which the user interacted with an experience and placed an order for the selected time period. |
| CVR (Conversion rate) |
|
| AOV (Average Order Value) |
|
| RPV (Revenue per Visitor) |
|
| Revenue |
|
| Annualized Inc. Rev. | Displays the Annualized Incremental Revenue of that triggered experience for the selected date range. |
NoteClick
icon in the upper right corner of the pane (ii) and select/deselect the columns to show/hide respectively the selected metrics from the table.
Downloading Metrics
To download the overview metrics of triggered experiences, follow the steps given below:
- In Insights, click the Triggered Experiences tab for which you want to download the metrics.
- Click the Download
 icon in the upper right corner of the pane (ii).
A CSV file is downloaded for that respective metrics.
The downloaded file contains similar metrics shown on that respective page. The filename contains the timestamp of the download initiation in name_yyyy-mm-dd HH mm AM/PM format. e.g., campaignMetrics_2021-06-11248PM
Updated about 1 year ago