Viewing Session Explorer
Session explorer is designed to discover and gain valuable insights into the system to identify the unique segments. With the help of session explorer, a business user can discover the unique segments based on different properties (Dimensions) (e.g, Device Context, Customer type, visit recency, EPP labels, and so on.) It displays the data for session metrics and business metrics across all sessions. These metrics can be filtered based on the above properties. In this way, a business user can plan an optimal experience contact strategy for certain segments.
Data on these properties will be fetched from the incoming sessions based on visitors' activities done on the app or website. These properties will be mapped to the axis of the cube. Mapping of these properties will be done only once per namespace. For mapping these properties, contact your admin to ensure that the properties relevant to your business interests have been mapped.
To view the session explorer, follow the steps given below
- Click the Insights menu.
- In the Insights menu, click the Session Explorer tab.
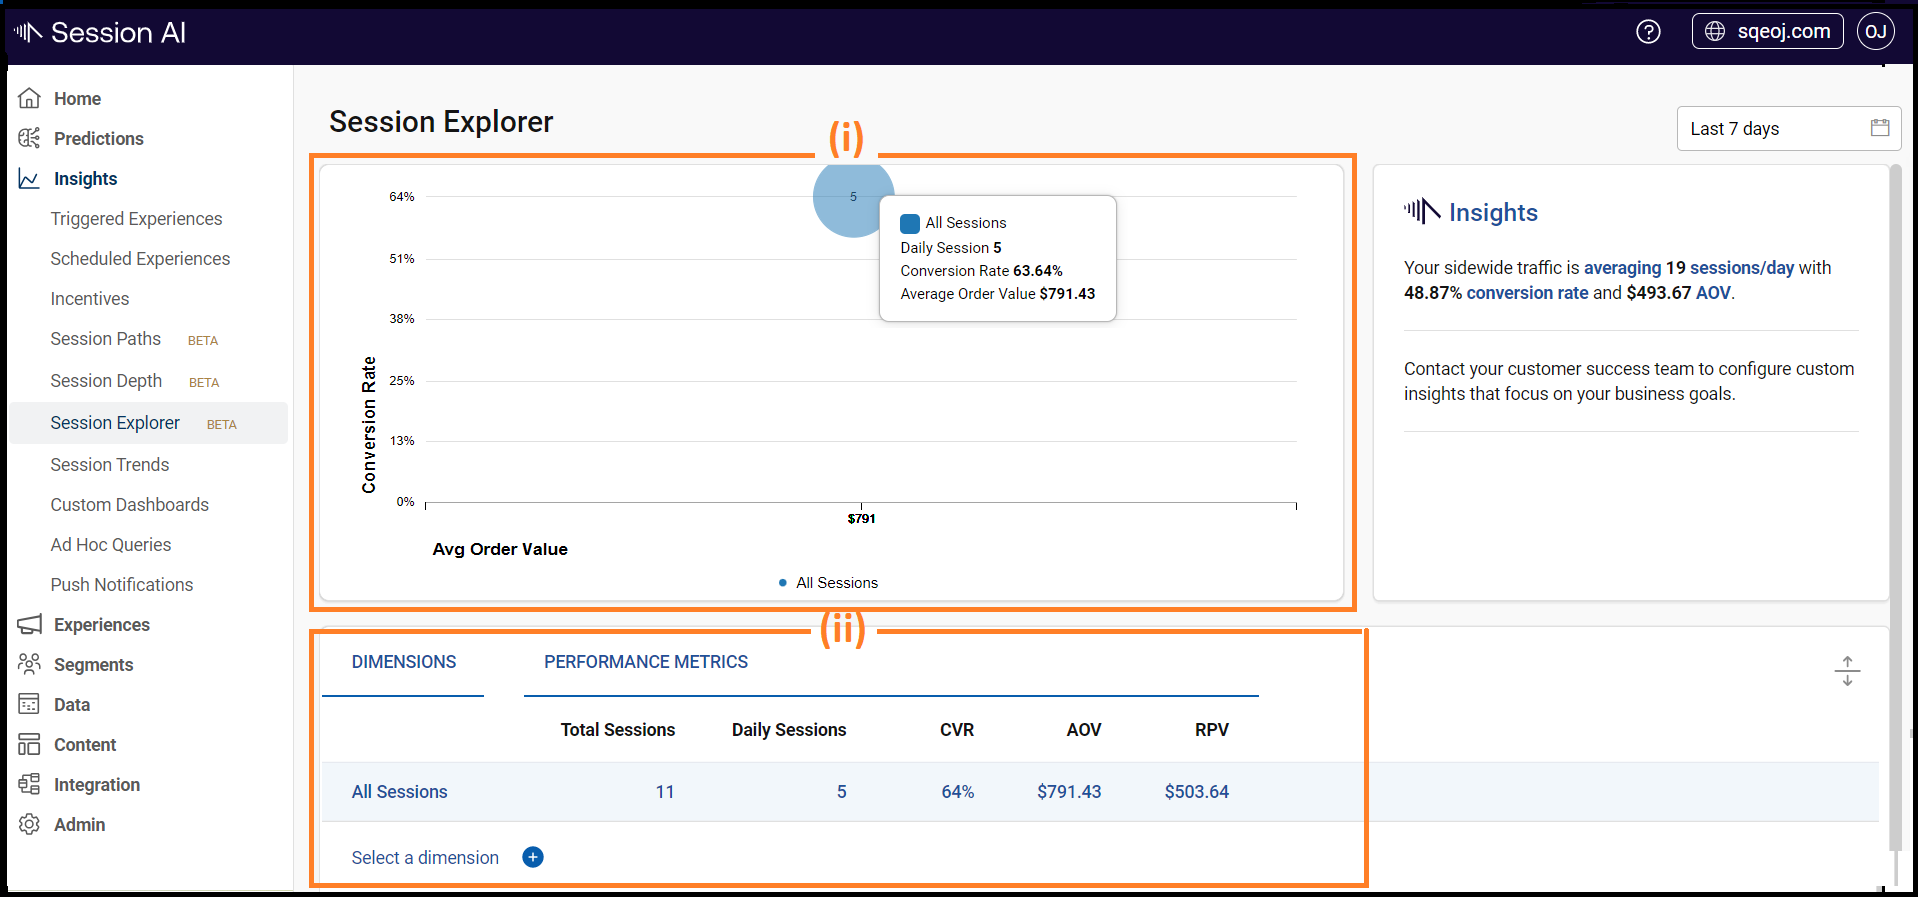
The Session Explorer window displays a bubble chart and performance metrics.
The metrics are displayed as per the selected time range.
NoteClick
icon to collapse/expand the pane (ii).
The Session Explorer page has two panes:
(i) Bubble Chart: This pane displays an average daily session count which will be the radius of the bubble. Note: Hover over the bubble to view the selected dimension and their respective performance metrics.
(ii) Performance Metrics: This pane displays a tabular view of data for the Dimensions and performance metrics (e.g., Total Sessions, Daily Sessions, CVR, AOV, RPV)
Note: By default, the Performance metrics will show data for All Sessions without any Dimension.
To filter the Sessions, CVR, AOV, and RPV data based on different dimensions click  icon to Select a dimension. Both the bubble chart and performance metrics pane will display the data according to the selected dimensions.

In the Bubble chart hover over the bubbles to view the data for all the selected dimensions.
Note: When clicking the dimension name legend, the bubble for that dimension is highlighted.

Note:All the selected dimensions are highlighted in the upper box. Click cross
icon to deselect the dimension in the same order.