Viewing Session Path
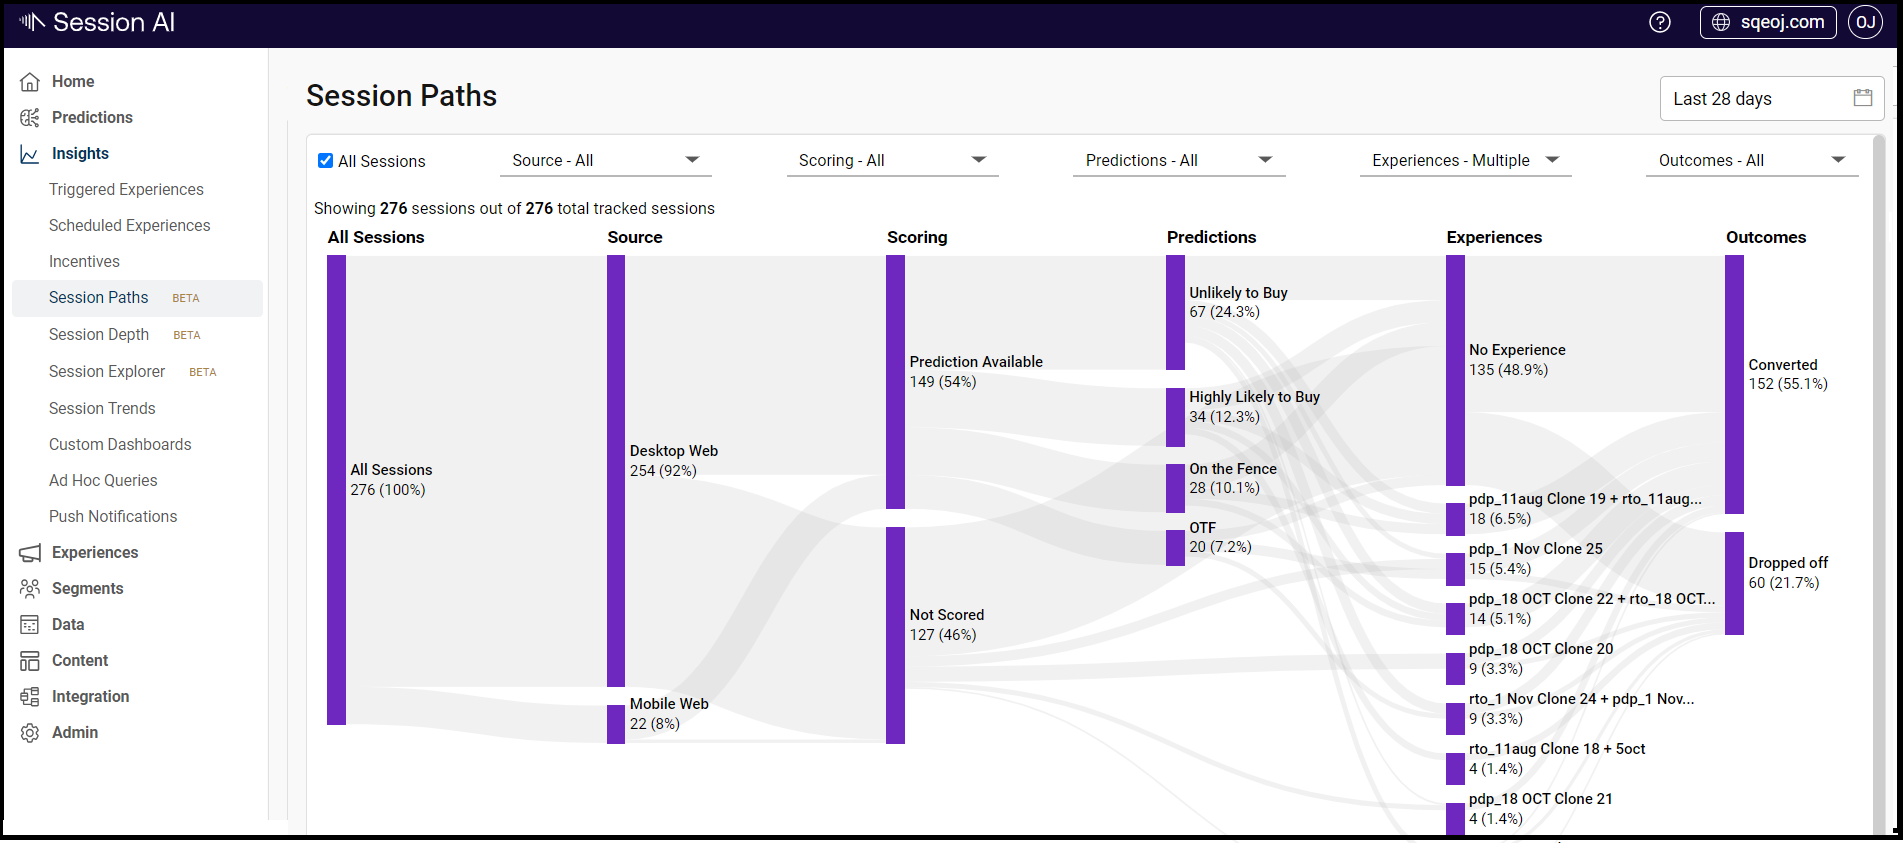
Session Path displays a Sankey chart that gives information about the number of all sessions and their breakdown for individual data channel sessions as well as sessions with predictions and those without a prediction.
To view the Session Path, follow the steps given below
- Click the Insights menu.
- In the Insights menu, click the Session Path tab.
The Sankey chart displays the session flow.
The metrics are displayed as per the selected time range.
Note: Control the chart with the filter nodes present in the header of the page.
Updated about 1 year ago