Understanding Operations
The Operations section of the Session AI platform shows namespace-level performance metrics. It shows metrics for all the active experiences and different channels used in the namespace.
To view the Operations Overview,
- In the Home menu, click the Operations.
The Operations Overview window displays the metrics for the past 30 days. - In the Time Range selector located in the top right corner, select the desired time range.
All the metrics are displayed as per the selected time range.
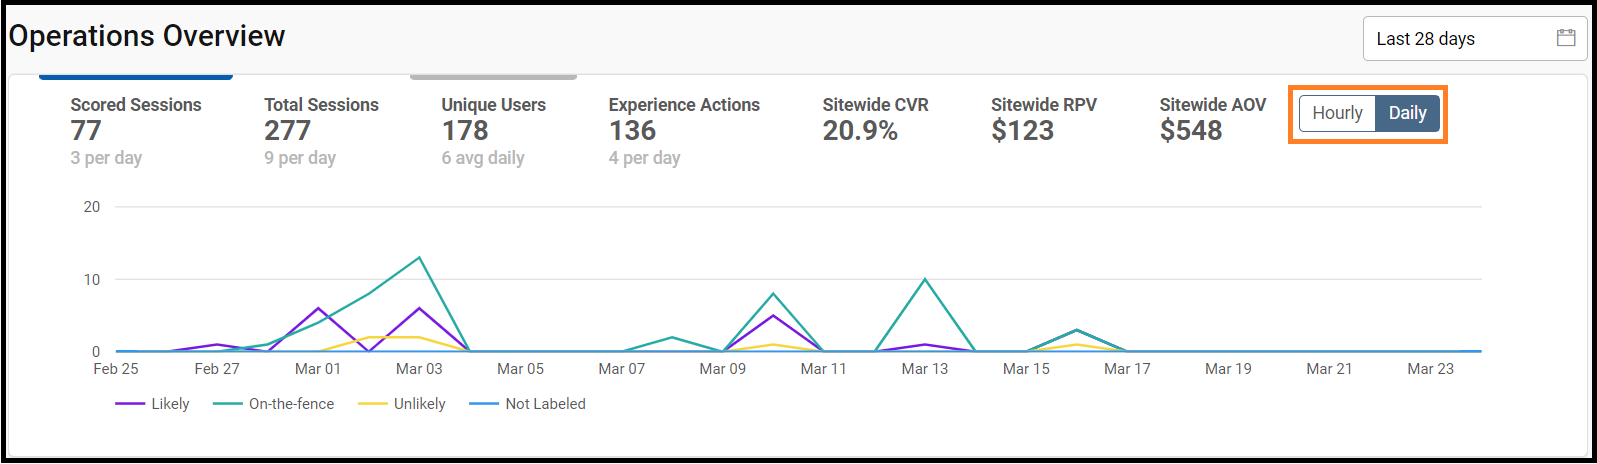
Operations Overview Metrics
The Operations dashboard displays both the namespace level as well as experience level performance metrics.
In each tab, all the top-level metrics are defined at the Namespace level and show the cumulative average for the selected time range. The additional assisted metrics displayed below the chart are Experience level insights for each tab.
NoteTo view and understand the performance metrics on shorter timeframes, select the timeframe between Daily and Hourly.
Click each Tab/Card to view their respective metrics.
Note:
- If you hover your mouse pointer on the graph, a tooltip message is displayed. The message shows comparison data between the current and previous periods.
The table given below describes different Tab/Card in Performance Metrics
| Tab/Cards | Description |
|---|---|
| Scored Sessions | -Displays the EPP Scored Sessions with at least one ML score generated and are expected to be the subset of total sessions per day with a 5th click event. |
| Total Sessions |
|
| Unique Users |
|
| Experience Actions |
|
| Sitewide CVR |
|
| Sitewide RPV |
|
| Sitewide AOV |
|
Doughnut Charts
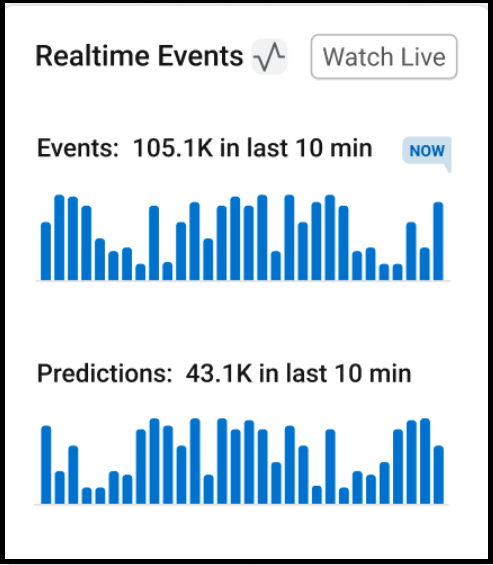
Realtime Events
Events: Displays a bar chart for the real-time count of incoming events in the last 10 Minutes. This card will be auto-updated continuously with the coming events. Hover over the bar to view Time, Events count, and Events/second.
Predictions: Displays a bar chart for the real-time prediction counts for the last 30 Minutes. This card will be auto-updated continuously every 10 seconds.
Channel
Displays the total number of user sessions across different channels. This helps to understand the session distribution across different channels.
Identity
Displays the total number of sessions by visitor identification. This helps to understand the number of visitors if anonymous or known users.
New vs Returning
Displays the total number of sessions by visit recency. This helps to understand if the visitor is a new user or returning user.
Purchase Prediction
Displays the early purchase prediction band. This helps to identify if the user is highly likely to buy, unlikely to buy, or on the fence.
