Viewing Custom Dashboard
Custom Dashboard helps Business User to view the graphs of the Dashboard Designer that are shared with the team. These dashboards show detailed data for different experiences, content, customers, and events.
To view the Custom Dashboard,
- Click Insights menu.
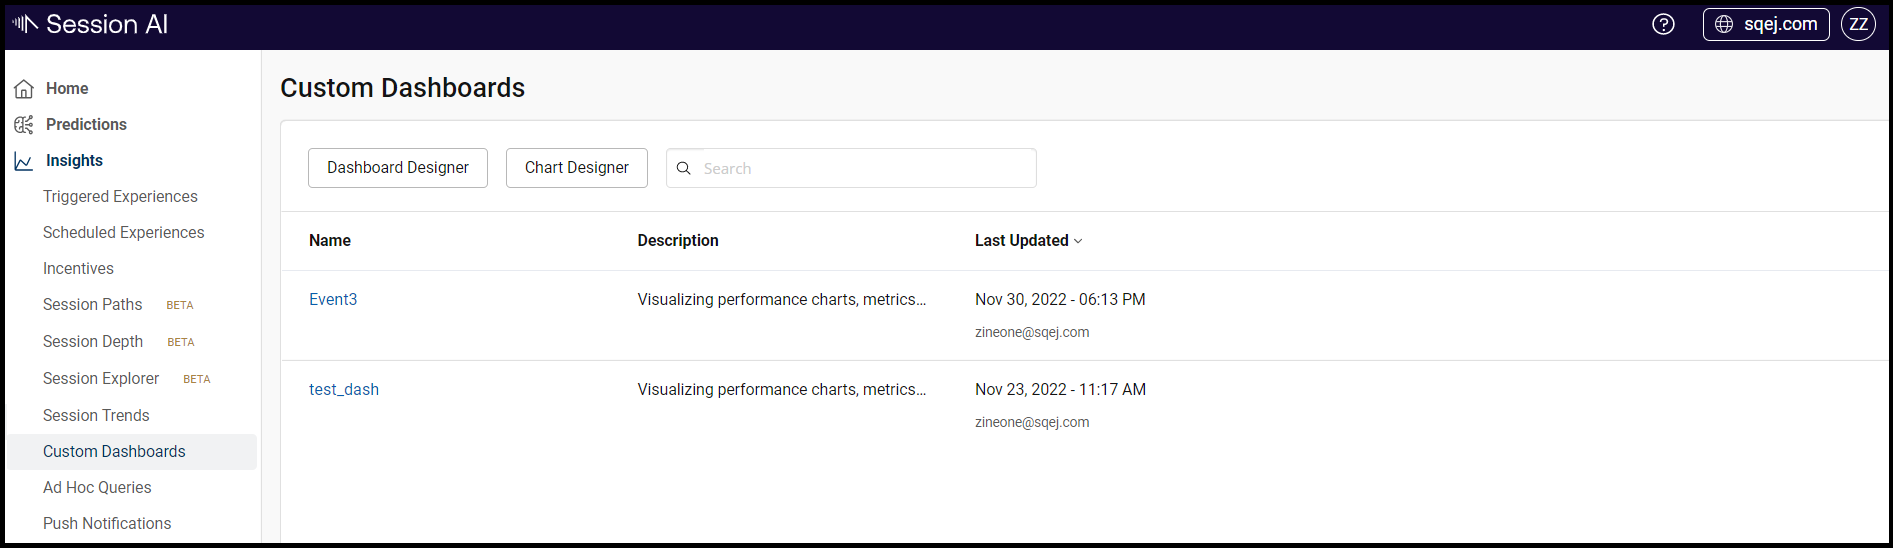
- In Insights, click the Custom Dashboards tab.
Custom Dashboards window is displayed. - Click the desired dashboard name to view it.
- Desired dashboard page is displayed.
- Select the time range from Time Range selector, located in the right corner.
The graph with respect to the selected time range is displayed.

Managing Dashboard Properties
To manage the dashboard properties,
- In the desired dashboard page, click Properties located in the top right corner page.
Dashboard Properties dialog box is displayed. - Switch ON the Show Date Picker toggle button to view the time range selector field on the dashboard page.
- Once you switch on the Auto Refresh toggle button, set the Refresh Interval as per your requirement.
To hide the branding bar on the shared dashboard, switch on the Hide the Session AI Header in the Shared dashboard toggle button.
Note: By default, all the toggle buttons are OFF. - Click OK.

Sharing the Dashboard
To share the dashboard page,
- In the desired dashboard name page, click Share located in the top right corner page.
Share link dialog box is displayed. - Click the Get shareable link icon.
- Dashboard link is displayed.
Anyone with this shared URL can view the dashboard.
