TE Performance Dashboard
Experiences performance dashboard helps the business user to view how well the experiences were delivered.
The performance dashboard displays performance metrics for each experience. It also displays the Qualified, Sent, Reached, Interacted, and Dismissed statistics for the experiences. If the experience was not sent, it displays the underlying reason.
This Performance dashboard of experiences displays:
Overview
The Overview tab will display the performance metrics for the experience. These metrics include Conversion Rate, Revenue Per Visitors, Average Order Value, Incremental Revenue, and Performance Summary.
To view the Performance overview, follow the steps given below:
- In the Experiences menu, click the Triggered Experiences tab.
The list of Triggered Experiences is displayed. - Click
 icon and then click View Dashboard for a desired Triggered experience.
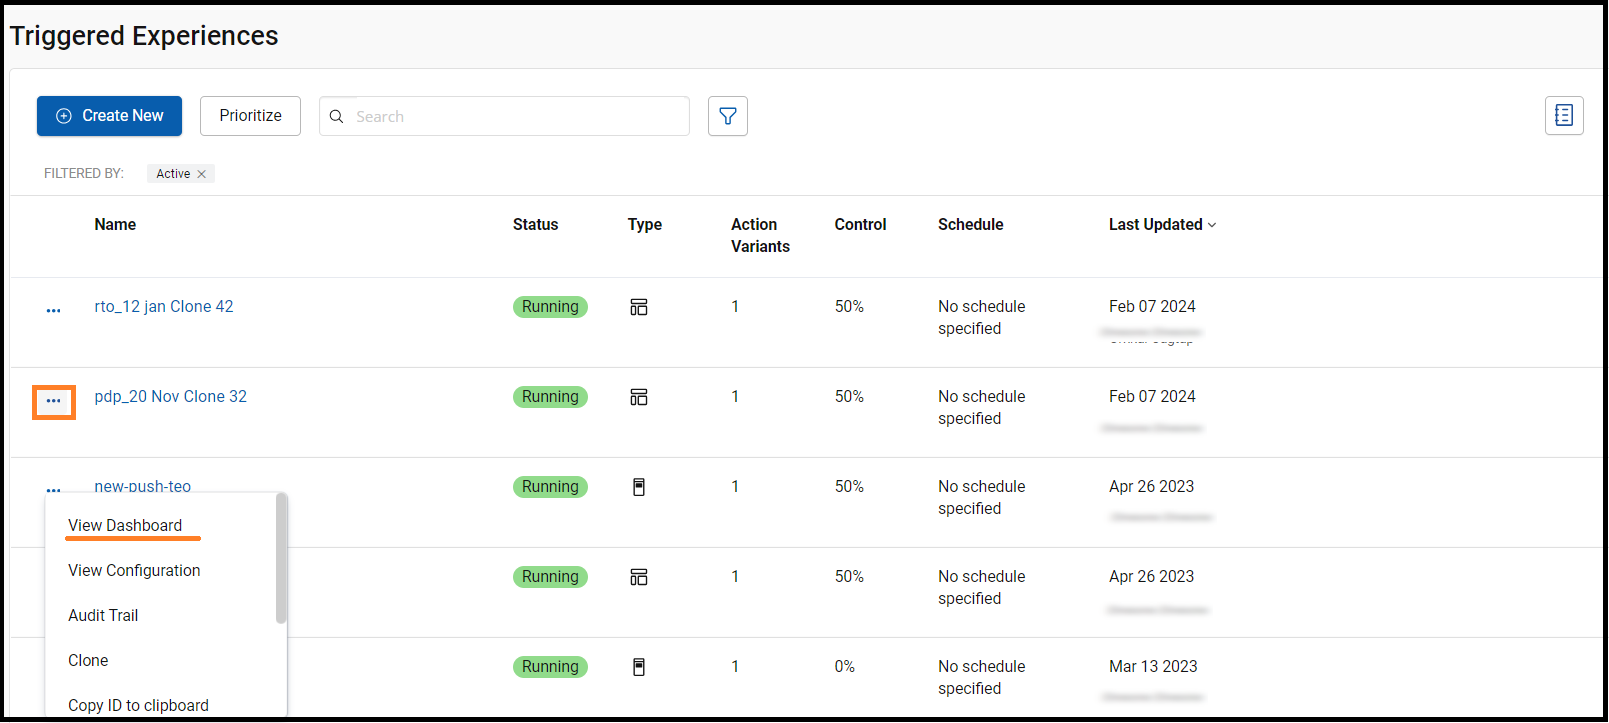
The performance dashboard displays the Overview tab for the selected experience.
- Click the Time Range Selector located on the top right corner of the page.
- Select and set the desired Time Range.
Note: In TE time range, click Select by version to view the version and configuration of that TE
The overview metrics for the selected time range are displayed.
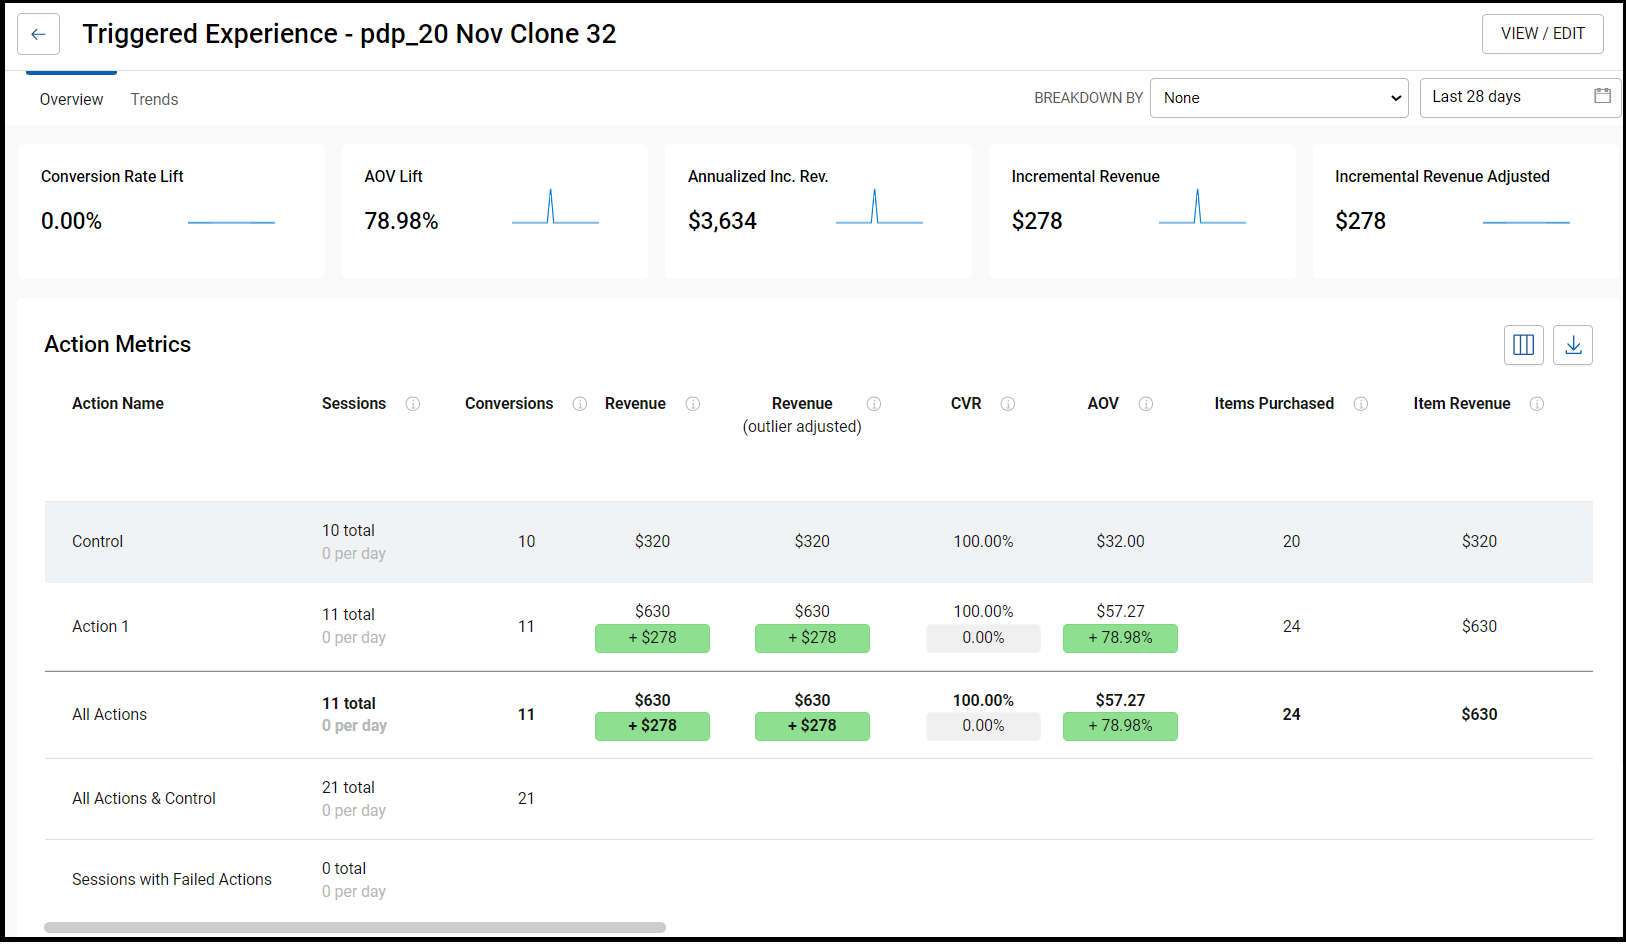
NoteTo navigate through more precise data, click the BREAKDOWN BY filter. This filter will display the session dimensions based on Data Channel (Mobile, Desktop, Native App) and Identity (Anonymous vs Known) for that TE
The table given below describes different metrics displayed on the Action Metrics screen.
| Metrics | Description |
|---|---|
| Conversion Rate (CVR) Lift | Displays the relative percentage change in conversion rate for the test group with respect to the control group.
|
| Average Order Value (AOV) Lift | Displays the relative percentage change in average order value for the test group with respect to the control group.
|
| Revenue Per Visitor (RPV) Lift | Displays the relative percentage change in revenue per visitor for the test group with respect to the control group.
|
| Incremental Revenue | Displays the total incremental revenue obtained by the test group visitors in comparison with control group visitors per number of Total Sessions
|
| Annualized Inc. Rev. | Displays the total number of incremental revenue for the year |
Note:
- By default only those KPIs will be visible which are selected while creating TE workflow.
- Click
Manage table column icon to select and view Session Metrics and other KPIs.
Action Metrics
| Metrics | Description |
|---|---|
| Action Name | Displays the type of actions in the experience. |
| Sessions | Displays the total number of sessions in the selected period followed by the per day session for that action |
| Conversions | Displays the total number of conversions for the action in the selected period |
| Revenue | Displays the total revenue obtained for the action in the selected period |
| Conversion Rate (CVR) | Displays the percentage of sessions in which the user interacted with an experience and at least one order was placed per number of Total Sessions |
| Revenue Per Visitor (RPV) | Displays the total revenue obtained at experience level per number of Total Sessions |
| Avg. Order Value (AOV) | Displays the revenue obtained at experience level per total number of orders placed |
Trends
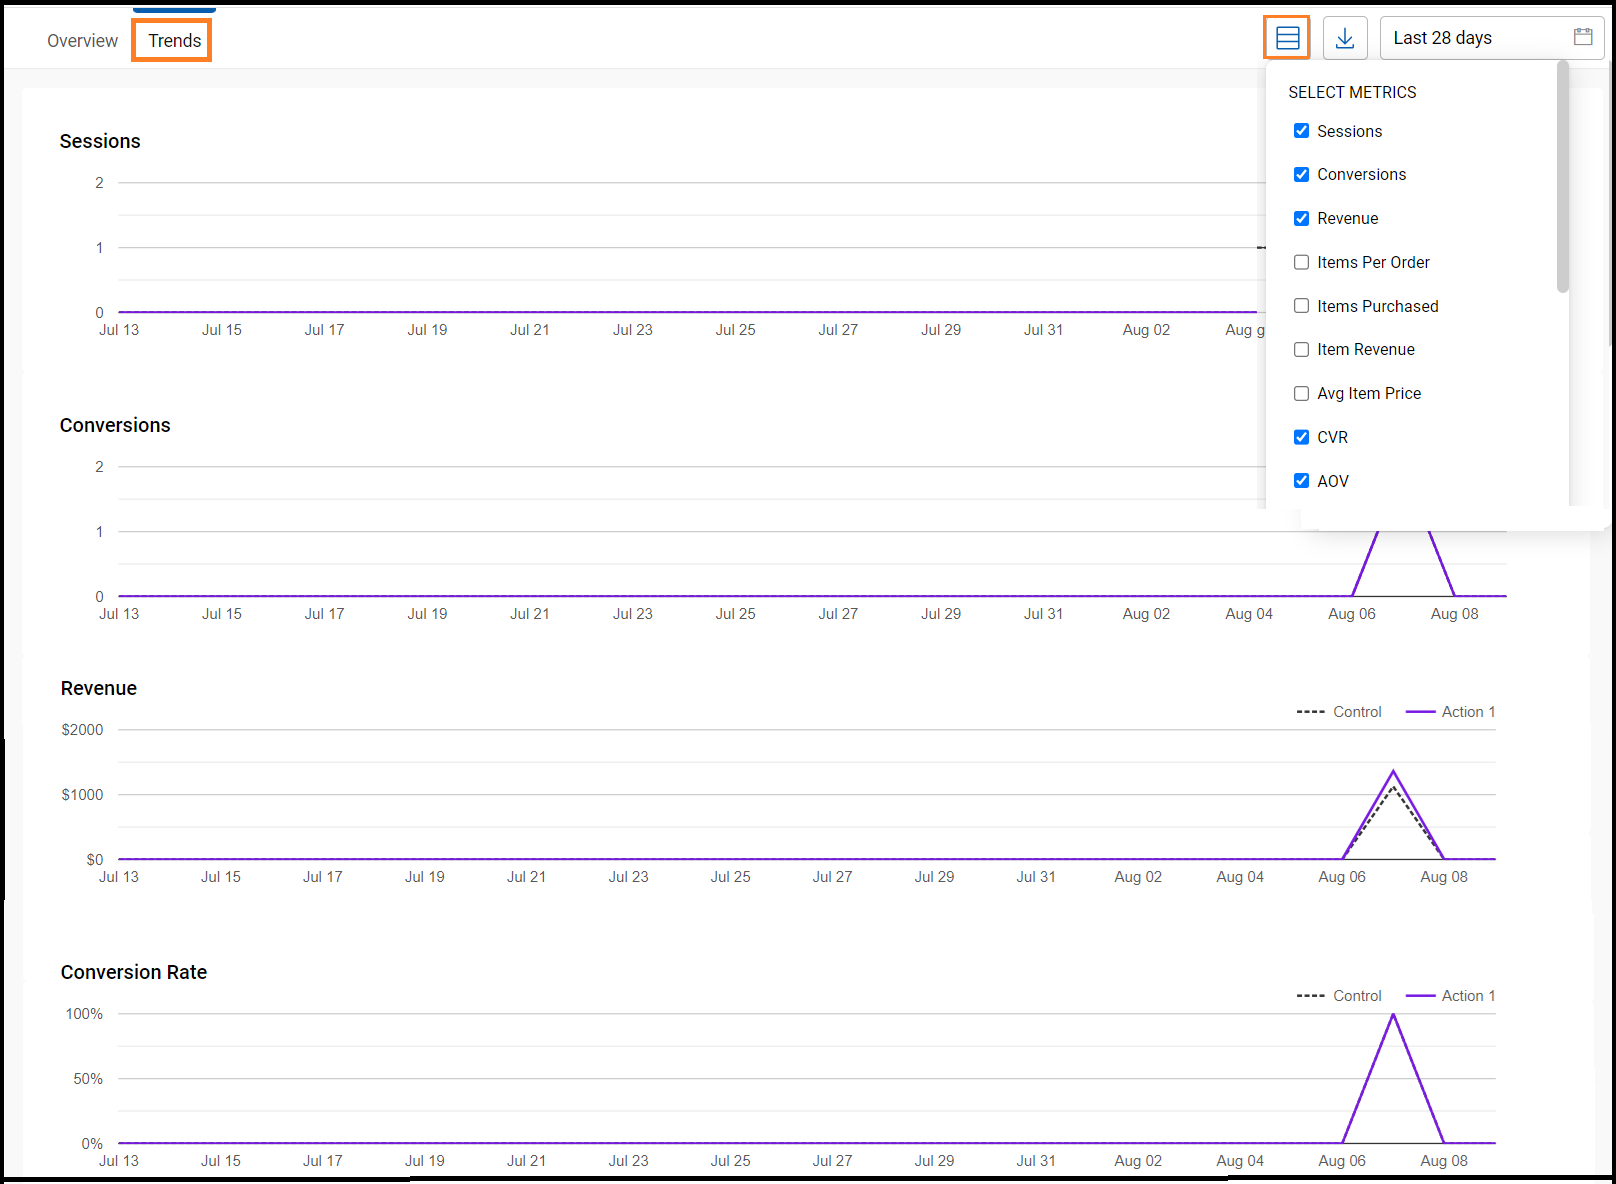
It displays the time series chart for Sessions, Conversion Rate, Revenue Per Visit, Average Order Value for action, and control of the experiences in the selected time range. If an experience has two actions e.g., push and banner, then the metrics will show data for both actions which gives more profound insight into each action.
To view the Trends, follow the steps given below:
- In the Experiences menu, click the Triggered Experiences tab.
The list of Triggered Experiences is displayed. - Click icon and then click View Dashboard for a desired Triggered experience.
- Click the Trends tab.
By default, the page displays the chart metric graphs according to the header KPI selected for the experience
Click  to select and personalize the Trends metric charts
Note
- Hover over the line chart to view the type of action and the metrics related to that action.
- Click Download icon to download the selected metrics on Trends tab.
Editing the Experiences
To configure the experiences, follow the steps given below:
- In the Experiences menu, click the Triggered Experiences tab.
The list of Triggered Experiences is displayed. - Click the Triggered experience you would like to edit.
- The Summary page of that experience will be displayed.
Edit the experience as per your requirement and then Publish it.
- Experience created from Templates will be taken to the configuration screen. Click Edit to step forward

Experience created from Templates:
- In the Configurations tab, the default selection is the latest changelog for the experience.
- The Edit button is visible only when the latest changelog is selected
Updated about 1 year ago