Creating Dashboard Designs
The Dashboard Designer section allows you to create charts using a chart designer and use these charts to build dashboards.
Solutions Developers can create dashboards using the following two approaches.
- Dashboard Designer Mode: Provides a user interface to select a layout and simply drag and drop the desired charts from the list.
- Dashboard Advanced Mode: This allows you to use a JSON format that defines the X-axis, Y-axis, text size, text color, chart color, cube, cube query, and view controller to draw a chart. The JSON format is referred to as the Data Sheet in the Session AI platform.
Dashboard Designer Mode
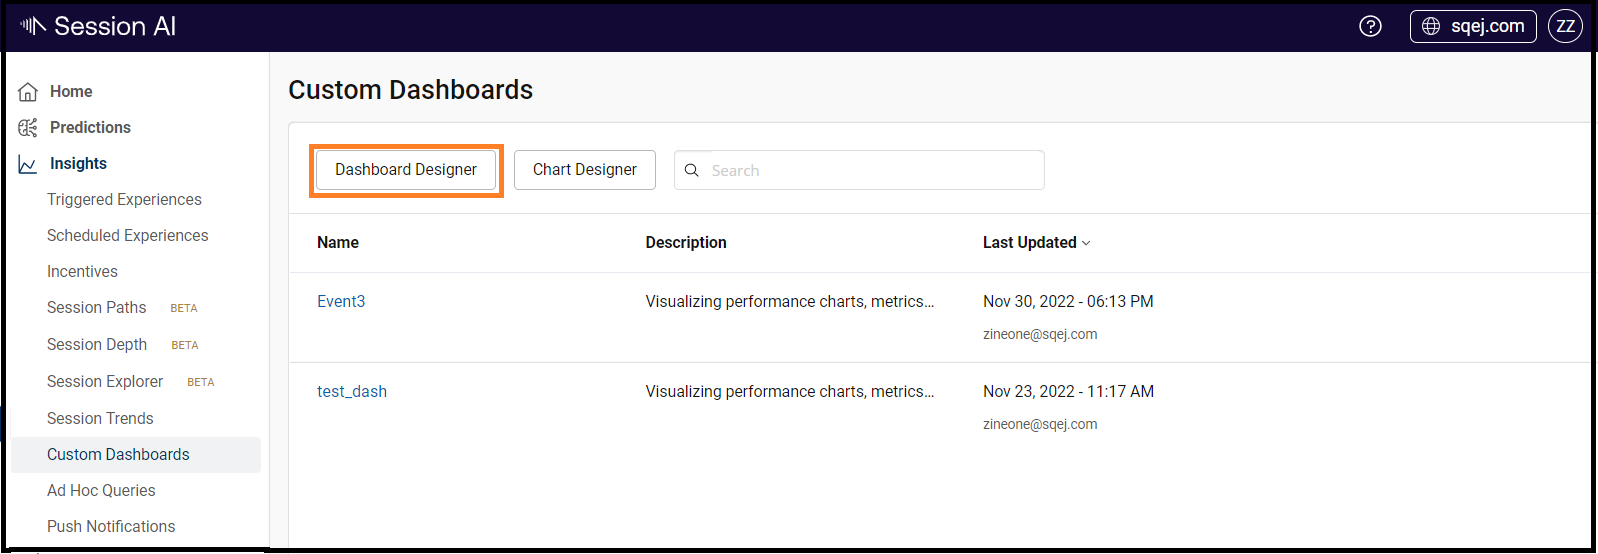
- In the Insights menu, click the Custom Dashboard tab.
The Custom Dashboards screen displays all the existing dashboards. - To create a new dashboard designer, click Dashboard Designer.
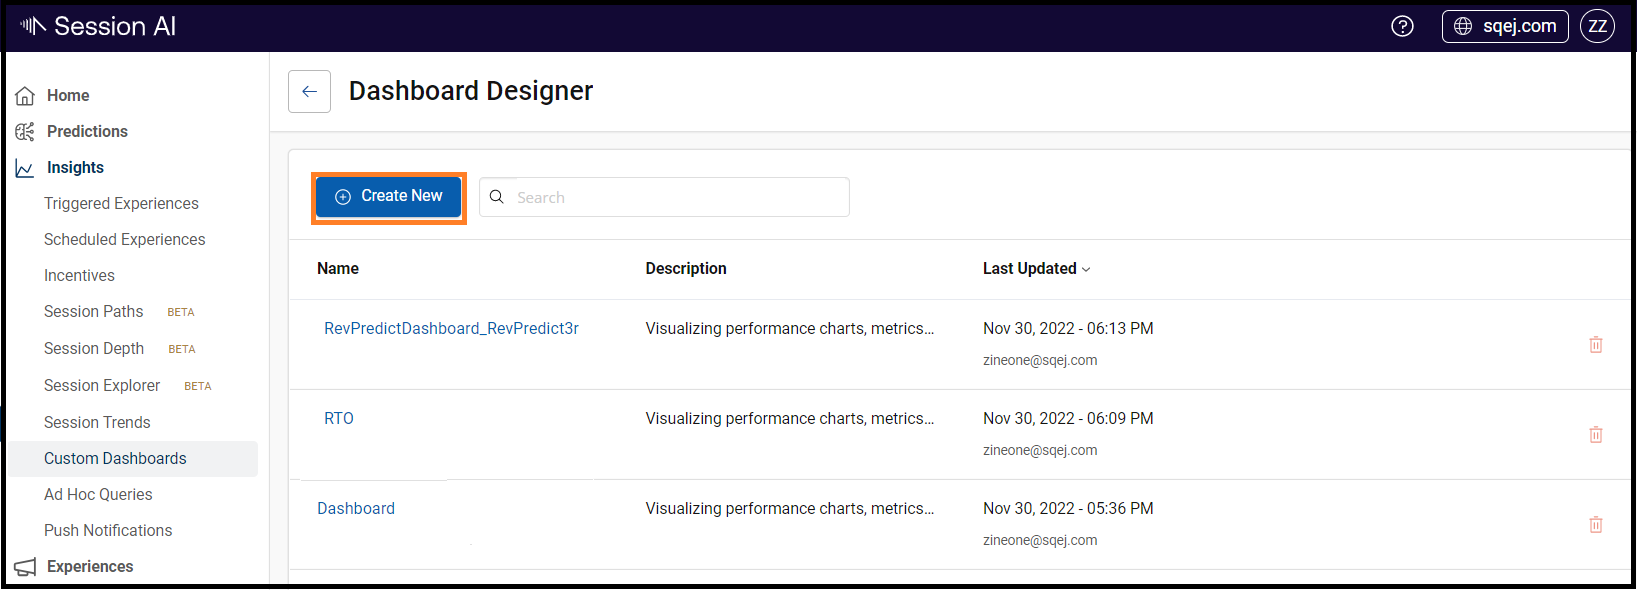
The Dashboard Designer screen gets displayed.
- Click Create New.
The My Dashboard screen appears.
- Perform the following:
- Dashboard name: Enter the name of your dashboard.
- Description: Enter the description.
- Enable Advanced feature to create complex custom dashboard: Skip this option to use the dashboard designer mode.
- Select your layout: Select the chart layout from the provided options.
- Click Next.

User Activity screen is displayed
- From the My Charts list, select the required chart. Drag and drop the chart in the space located on the right side.
Note: In this example, we selected the View Activity Occurrence chart.
A visual display of the dashboard appears.
7. Click Save.

The following screen is displayed.

- You can further use the following options to customize the chart properties, edit the chart, and share the chart with your team.
- Properties: Click the button. The Dashboard Properties window appears with the following settings:
- Show Date Picker: Select to display a date picker on the dashboard. The user can view the chart for a selected date range.
- Auto Refresh: Select to provide refresh intervals in hours, minutes, or seconds.
- Hide the Session AI Header in the Shared dashboard: Select to hide the branding bar on the shared dashboards.
- Background Image: Enter the image URL.
- Share: Allows you to share the dashboard with team members or anyone who has access to your namespace.
- Get shareable link : Click it to generate the link. You can share the link with anyone. Once you have generated the link, along with it, the Remove Shared URL button appears. Click it to delete the URL.
- Share With: Select the check box to share it with your team.
- Edit: Click to change the chart.
- Close: Closes the dashboard and displays the Dashboard Designer screen.
Dashboard Advanced Mode
- In the Insights menu, click the Custom Dashboard tab.
- On the custom dashboard page, click Dashboard Designer.
The Dashboard Designer screen gets displayed. - Click Create Dashboard.
My Dashboard screen appears. - Perform the following:
- Dashboard name: Enter the name of your dashboard.
- Description: Enter the description.
- Enable Advanced feature to create complex custom dashboard: You can copy and paste a JSON file in the editor to create complex dashboards. Enable the toggle and click Next to continue.
- Select your layout: Skip this option to use the advanced dashboard designer mode.
- Click Next.

The following is a sample dashboard that appears on the screen.
- You can further use the following options to customize the chart properties, edit the chart, and share the chart with your team.
- Properties: Click the button. The Dashboard Properties window appears with the following settings:
- Show Date Picker: Select this option to display a date picker on the dashboard. The user can view the chart for a selected date range.
- Auto Refresh: Select this option to provide refresh intervals in hours, minutes, or seconds.
- Background Image: Enter the image URL.
- Share: Allows you to share the dashboard with team members or anyone who has access to your namespace.
- Get shareable link : Click to generate the link. You can share the link with anyone. Once you have generated the link, along with it, the Remove Shared URL button appears. Click it to delete the URL.
- Share With: Select the checkbox to share it with your team.
- Edit: Click to change the chart.
- Close: Closes the dashboard and displays the Dashboard Designer screen.

Note:By default, the Dashboard Designer queries in UTC time format.
The feature to configure a specific timezone is only available through advanced dashboards. The following is a sample JSON snippet to add timezone. You can use any of the IANA timezone codes.
"properties": {
        "dateFilterOptions": [],
        "tz": "PST" //Enter a three to five letter timezone code
    }