SE Performance Overview
Experiences dashboard helps the business user to view how well the experiences were delivered.
The performance overview displays the Qualified, Sent, Reached, Interacted, and Dismissed statistics for the experiences. If the experience was not sent, it displays the underlying reason.
This section describes:
Scheduled Experience Performance overview
To view the Performance overview of scheduled experiences, follow the steps given below:
-
In the Experiences menu, click the Scheduled Experiences tab.
The list of scheduled experiences is displayed. -
Click

icon and then click View Dashboard for a desired experience.
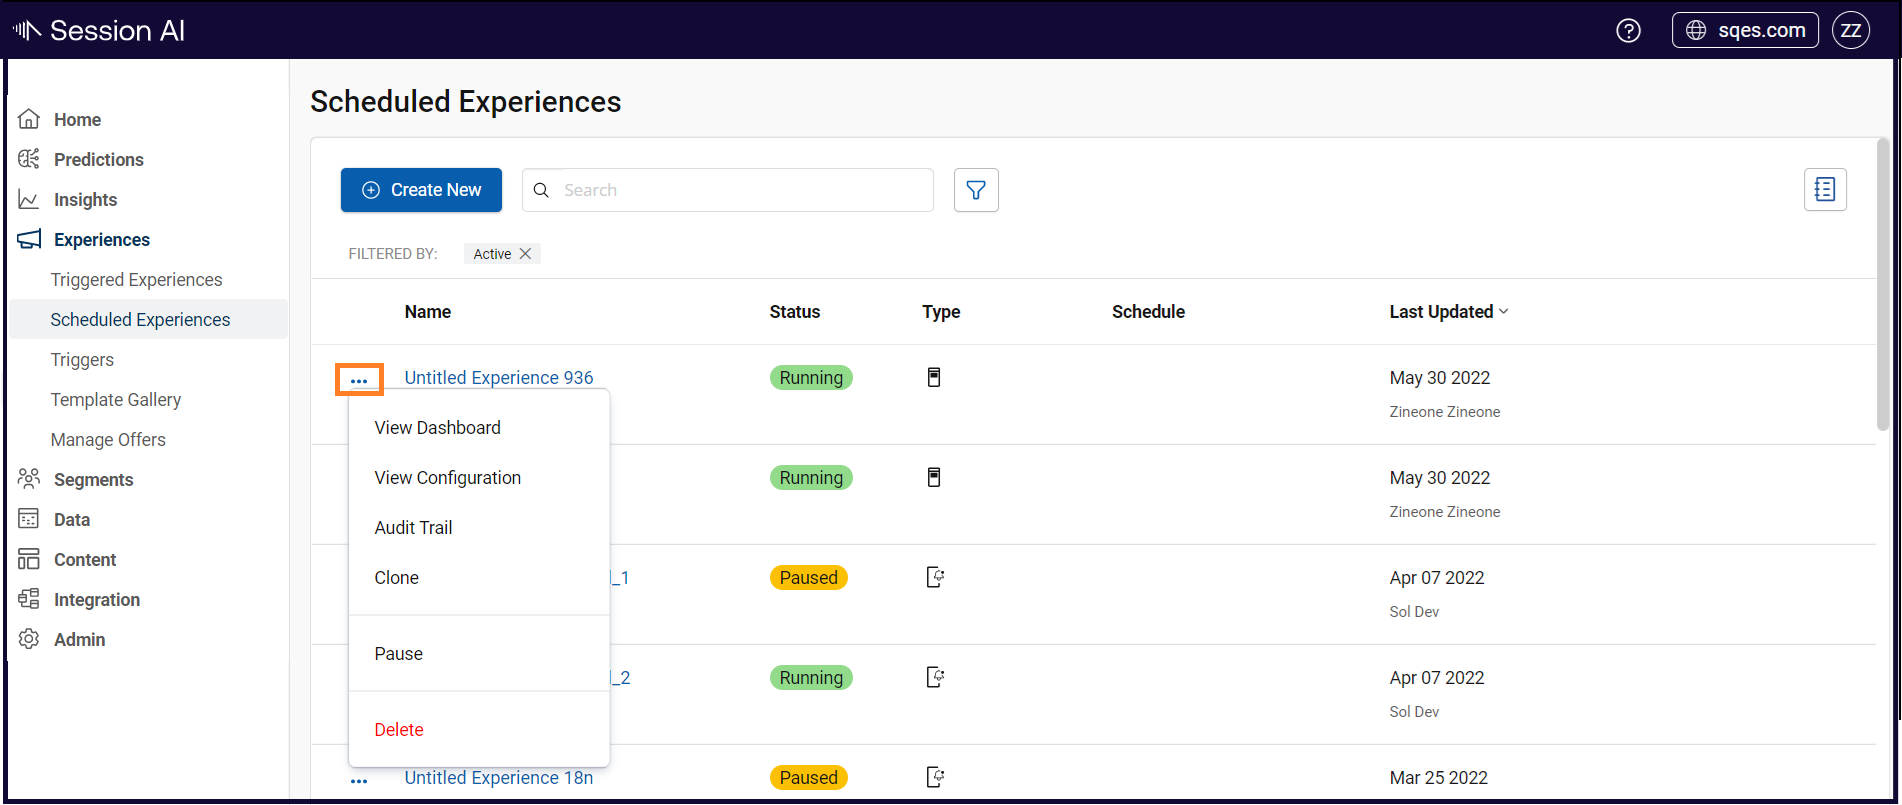
Overview tab showing Performance Overview for the experience is displayed.
- Click the Time Range Selector located on the top right corner of the page.
- Select and set the desired Time Range.
Note:By default, all metrics display data for the past 30 days.
The performance overview metrics for the selected time range are displayed.

The table given below describes different metrics displayed on the Performance Overview screen.
| Metrics | Description |
|---|---|
| Action Name | Displays the name of the Experience. |
| Sent | Displays the total number of actions sent to customers when interaction rules are matched. |
| Reached | Displays the total number of notifications reached to the customers. |
| Interacted | Displays the total number of notifications opened or interacted by the customers. |
Scheduled Experience Flow
To view the Message Flow, follow the steps given below:
-
In the Experiences menu, click the Scheduled Experiences tab.
The list of scheduled experiences is displayed. -
Click
icon and then click View Dashboard for a desired experience.
-
Click the Flow sub-tab.
The message flow displays a Sankey chart that illustrates the flow of action execution. It branches into Qualified, Sent, Reached, Control Group, and Interacted.

- The change log will show All Time as the default option in Scheduled experiences created from a template. It shows the sum of all the metrics for different configs for the experience.
- Click the change log drop-down located at the upper-right corner of the page.
It displays the following configuration:
- Test Group & Control Group: This shows the percentage of users that are in the Test vs. Control group.
- A/B Test: This indicates whether the Experience applied A/B testing to the selected actions.
- Actions: This is the number of actions defined in the Experience at the time of execution.
- Is Silent: A S tag in this column indicates that this Experience was running in silent mode. An experience in silent mode executes all of its supporting logic but it does not complete the final step of sending out the qualified action.
- Date: This displays the time at which the experience configuration was changed.
- Click the configuration to view its detailed message flow information.
Updated about 1 year ago